Big thanks to everyone who completed our 1-question survey this month.
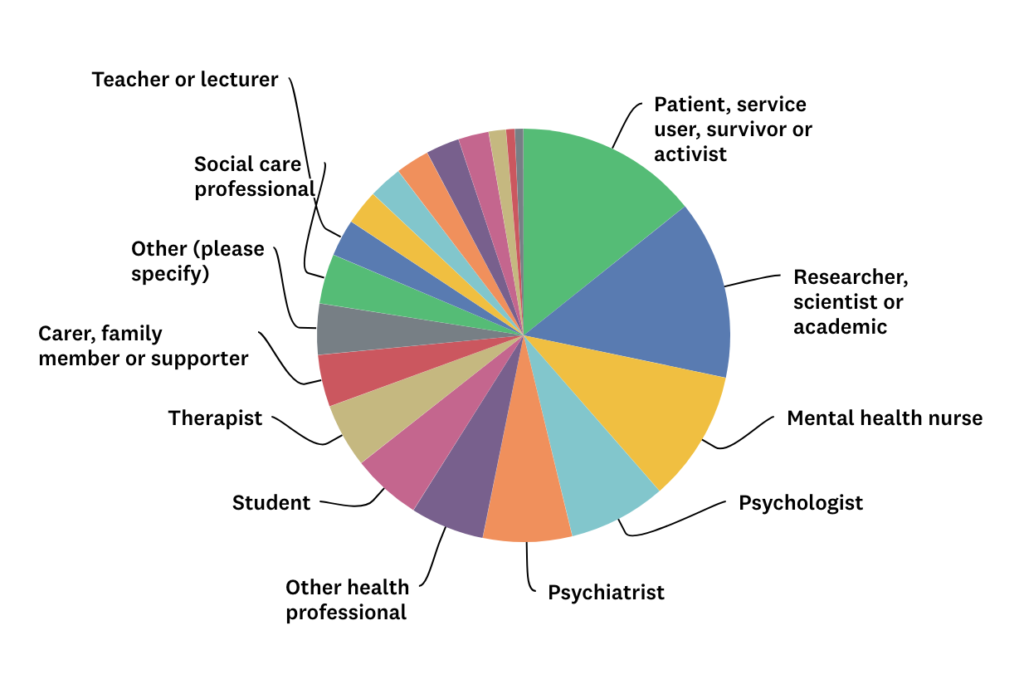
We asked you to pick which one of twenty roles best described you, so that we could get a sense of the sort of people who follow us on social media and read our blogs.
We had an overwhelming response! Well over a thousand people (1,177 to be exact) completed the survey and here are the results.
- 74.6% of our audience can broadly be described as professionals. This includes health and social care professionals, researchers, teachers and others
- 18.4 % of our audience can broadly be described as patients, service users, survivors, activists or carers
- Every group that we included in our survey got at least 8 responses; from citizens to scientists, from survivors to students, from psychologists to psychiatrists and everything in between. It’s especially pleasing that we’ve built such a diverse group of followers because this makes the conversations that we have around evidence much more democratic and meaningful.

The Mental Elf is aimed at health and social care professionals, but gets read by people from many different backgrounds.
Survey results
Here is the percentage breakdown of results from the survey we ran from the 12th to the 23rd January 2018:
| Primary role | % of total audience |
| Patient, service user, survivor or activist | 14.27% |
| Researcher, scientist or academic | 14.02% |
| Mental health nurse | 10.28% |
| Psychologist | 7.65% |
| Psychiatrist | 6.97% |
| Other health professional | 5.78% |
| Student | 5.44% |
| Therapist | 5.01% |
| Carer, family member or supporter | 4.08% |
| Other (please specify) | 3.99% |
| Social care professional | 3.91% |
| Teacher or lecturer | 2.89% |
| Occupational therapist | 2.72% |
| Counsellor | 2.63% |
| Librarian or information scientist | 2.63% |
| Manager/commissioner | 2.63% |
| Charity worker | 2.38% |
| Pharmacist | 1.36% |
| Health visitor | 0.68% |
| Journalist or blogger | 0.68% |
