The Office for National Statistics (ONS) has created an estimate of exposure to generic disease, and physical proximity to others, for UK occupations based on US analysis of these factors (ONS, 2020).
Background
The ONS produced a bubble plot on the 11th May to illustrate in their own words the:
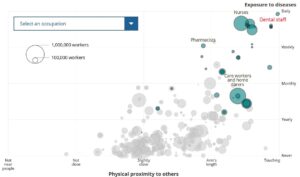
clear correlation between exposure to disease, and physical proximity to others across all occupations. Healthcare workers such as nurses and dental practitioners unsurprisingly both involve being exposed to disease on a daily basis, and they require close contact with others, though during the pandemic they are more likely to be using PPE.
From the plot it is clear to see that dentistry (dentist and dental nurse) are in the extreme top right corner denoting the highest exposure to disease and closes proximity to other people in the workplace, not only patients but also staff (Figure 1).
Figure 1. ONS Exposure to disease vs proximity to others
It is extremely easy to misinterpret this chart and I would argue this could be a classic case of ‘correlation does not imply causation’. Though technically we are as a profession, very close to our patients faces this does not imply that we, or the patients are at higher risk of catching a disease. Since the emergence of Human Immunodeficiency Virus (HIV) in the early 1980’s the dental profession has been fully aware of the risk that blood borne (Hep B+C), and respiratory infections (TB, SARS, MERS, H1N1) pose to both the patients, staff and population in general. The use of high levels of personal protective equipment (PPE), and staff who are specially trained in decontamination and cross infection measures has been normalised in the dental profession for over the past forty years.
Methods
To illustrate this, I thought it might be interesting to see how the dental profession compared to similar professional groups using the ONS’s ‘Occupations and exposure to disease’ and ‘All death occurrences at ages 16 to 74 in England and Wales between 2001 and 2010’ data sets. From the 299 diagnostic codes for mortality I selected the 24 codes that represented respiratory disease excluding cancer (See Annex A). From this data five additional groups were selected where the demographics and data were comparable to dentist’s socio-economically, the 10 years mortality rate and relative risk were calculated based on weighted means.
Results
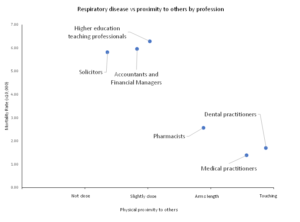
There were six professional groups were dentists, doctors, pharmacists, solicitors, higher education teaching professionals, and accountants/financial managers. Broadly speaking even though the dentists are physically closest to the patient, and potentially at the greatest risk of exposure they had 3.5 times less respiratory disease than their non-healthcare peers. Doctors were just slightly lower risk than the dentist (Figure 2, Table 1.)
Figure 2. Respiratory disease vs profession
Table 1. Occupation data
| Occupation title | Dentists | Doctors | Pharmacists | Solicitors | Higher education | Accountants |
| Proximity to others
(ONS units?) |
97.0 | 89.2 | 72.0 | 34.0 | 50.7 | 45.75 |
| Exposure to disease
(ONS units?) |
90.0 | 91.2 | 76.0 | 14.0 | 11.1 | 3.4 |
| Total in employment | 41,000 | 296,000 | 70,000 | 122,000 | 178,000 | 361000 |
| Percentage female | 52.6 | 48.9 | 67.6 | 56 | 46.4 | 44.8 |
| Percentage aged 55+ | 11.8 | 16.5 | 14.9 | 18.9 | 25.8 | 16.9 |
| Percentage BAME | 28.2 | 27.9 | 32.4 | 14.4 | 9.9 | 11.3 |
| Respiratory disease male age 16 to 64 (excl. cancer) | 6 | 33 | 10 | 59 | 95 | 169 |
| Respiratory disease female age 16 to 64 (excl. cancer) | 1 | 8 | 8 | 12 | 17 | 46 |
| Respiratory disease total age 16 to 64 (excl. cancer) | 7 | 41 | 18 | 71 | 112 | 215 |
| Mortality rate (MR) | 1.71 | 1.39 | 2.57 | 5.82 | 6.29 | 5.96 |
| Relative risk (RR) | 1.00 | 0.81 | 1.51 | 3.41 | 3.69 | 3.49 |
Discussion
From the data presented in this opinion piece we can clearly see that the dental profession works in an environment that poses a high risk of exposure to respiratory disease. We can also see that as a profession we suffer less respiratory disease than our peers, especially those not working in the healthcare sector, and I would propose this is due to the high degree of training regarding cross-infection and careful use of PPE. It is important however to remember that this data was collected between 2001 and 2010 so it does not represent the current situation regarding Covid-19.
Reference
ONS. 2020. Which occupations have the highest potential exposure to the coronavirus (COVID-19)? [Online].[Accessed 18th May 2020].
Appendix A. Respiratory diseases (excluding cancer)
| Respiratory Disease |
| Influenza |
| Tuberculosis |
| Viral pneumonia |
| Pneumococcal pneumonia |
| Other bacterial pneumonia |
| Other specified pneumonia |
| Bronchopneumonia |
| Unspecified lobar pneumonia |
| Unspecified pneumonia |
| Acute bronchitis/bronchiolitis |
| Chronic bronchitis and emphysema |
| Asthma |
| Bronchiectasis |
| Coal worker’s pneumoconiosis |
| Asbestosis |
| Silicosis |
| Other and unspecified pneumoconiosis |
| Pneumoconiosis with tuberculosis |
| Byssinosis |
| Airways disease due to other specific organic dust |
| Farmer’s lung disease |
| Bird fancier’s lung |
| Other and unspecified allergic pneumonitis |
| Respiratory conditions from chemical fumes |
| Pulmonary fibrosis |


[…] Which occupations have the highest potential exposure to the coronavirus (COVID-19)? […]
Great analysis. Wondered if smoking has to be influential in respiratory diseases – was that taken into account. Teachers, solicitors, accountants. Do they smoke more than medics and dentists?
Teachers, Solicitors and accountants were chosen for comparators as they sit in the UK managerial and professional occupations group with dentists and medics. We know that In the UK, around 1 in 4 (23.4%) people in routine and manual occupations smoked, this is around 2.5 times higher than people in managerial and professional occupations (9.3%). We also know that Adults with higher levels of qualifications were less likely to be current smokers and only 8% of those with a degree were current smokers, compared to 28% with no formal qualifications.
There may be a smoking gradient within the the managerial and professional occupations group but it seems likely to be small.
https://www.ons.gov.uk/peoplepopulationandcommunity/healthandsocialcare/healthandlifeexpectancies/bulletins/adultsmokinghabitsingreatbritain/2019